
What is Vibration Analysis?
Vibration analysis is the process of gathering vibration levels from the surface of machinery and then analyzing them to detect various faults or failures developing inside it.
The vibration levels are gathered with the help of vibration capturing sensors called accelerometers.
What defects can be captured with the Vibration Analysis Method?
Almost all types of faults that occur in rotating or reciprocating machines, like Unbalance, Misalignment, Looseness, Bearing defects, Belt defects, pump cavitation, etc can be determined by the Vibration Analysis technique.
How data captured is analyzed in Vibration Analysis?
The data captured with the help of sensors can be viewed in either of the two forms-
1. Time Domain
2. Frequency Domain
Now let’s see how vibration data is analyzed in each measurement form.
1. Time Domain Form
The time-domain form shows data in an Amplitude(Y-axis) vs Time(X-axis) graph. This is the raw signal that is captured by most vibration analyzers or accelerometers. The vibration amplitude can be represented by various forms or parameters like Acceleration, Velocity, or Displacement. Although all these parameters are interrelated, each has its own importance in fault detection inside the machine which will be described later in this article. The time domain data can be used for diagnosing Gears & Bearing Faults, Rubbing, Impacting, Rotating Looseness, Cavitation and Beating.
What are the Overall Vibration Measurements?
The following are referred to as overall vibration measurements:
- Displacement (Peak to Peak)
- Velocity (Peak)
- Acceleration (True Peak)
- High-Frequency Accelerations (RMS)
RMS value is defined as the square root of means of squares of instantaneous values.
Peak (Derived Peak) = √2 x RMS . The Derived Peak is usually referred to as Peak.
True Peak is the maximum value attained during one cycle of vibration waveform is called its True Peak value.
Peak to Peak is the difference between the maximum positive and the maximum negative amplitudes of a waveform.
Displacement – Is derived from the acceleration data or directly measured using an LVDT or laser probe. It is the total distance traveled by a vibrating body from one extreme to the other. Displacement is a measure of mechanical stress. It is measured in mills. Mills is 1/1000 of an inch.
Velocity – This is derived from the acceleration data and is measured in m/s or inch/sec. It is the rate of change of displacement. Velocity is a measure of mechanical fatigue.
Acceleration – Is measured using an accelerometer and is measured in g’s (g=9.8 m/s2). It is the rate of change of velocity and represents the forces experienced by the equipment.
High-Frequency Accelerations or Energy – This is the acceleration RMS or the peak in the filtered high-frequency band ( Usually 5 kHz to 50 kHz band).
Why are they important?
These are called overall measurements as they provide an overall single value of measurement instead of a spectrum. Overall measurements can be used for identifying a developing fault in a piece of equipment. Overall measurements can be trended over time to make out the trend in machine health. Overall measurements have their own limitation and it is not possible to identify the specific fault as it requires identifying values at a specific frequency.
You can read more about overall vibrations here.
How to choose the right overall measurement metrics?
You must understand the use and limitations of each overall measurement before you start using them.
| Overall Measurement | Application | Where to use it? |
Displacement Peak to Peak | Used for analyzing stress-related defects occurring in orders of rotating frequency. | Displacement is a good measure for low-frequency vibration and is not suited for high-frequency vibration. It can be used for analyzing frequencies of less than 20Hz. It can be used on equipment running up to 1200 rpm. |
Velocity Peak | Used for analyzing fatigue-related defects occurring in orders of rotating frequency. | Velocity is a good measure for medium frequency vibration. It can be used in the 10Hz (600 CPM) to 1KHz (60,000 CPM) frequency range. It can be used on equipment running from 1200 to 3600rpm. |
| Acceleration True Peak or High-Frequency Accelerations RMS | Used for analyzing force related defects occurring in the high-frequency band. | Acceleration is a good measure of high-frequency vibration. It can be used for analyzing frequencies of more than 1KHz (60,000 CPM). It can be used for identifying bearing, cavitation, and lubrication issues. |
2. Frequency Domain Form
Next is the Frequency Domain form where you can see the data in Frequency(X-Axis) vs Amplitude(Y-Axis) form.
This form is also known as Spectrum Form or Spectrum Graph as you view a spectrum of frequencies i.e. all the frequencies of which the composite waveform displayed in the Time(X-Axis) vs Amplitude(Y-Axis) form is made up of.
Another name is FFT Graph as the conversion from Time vs Amplitude Graph to Frequency vs Amplitude is done with the mathematical model called FFT or Fast Fourier Transform.
How to analyze the Spectrum Graph?
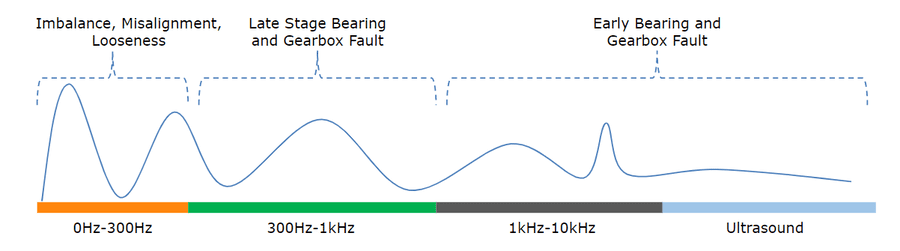
The principle behind analyzing the graph and detecting the faults is that each fault displays its own characteristics inside the spectrum graph. Order analysis and frequency analysis are the usual techniques used.
What are the types of data plots for vibration analysis?
The following data plots or charts can be used for vibration analysis:
- Waterfall Plot
- Circular Plot
- Polar Plot
- Bode Plot
- Orbit Plot
Final Words
So, the above was brief on the vibration analysis technique.
The method of vibration analysis is certainly great for detecting early faults and failures in rotating machines.
In fact, it’s capable of telling you the fault (1-2) months before its arrival.
But since the vibration analysis method requires manual measuring and analyzing the data, the work becomes quite tedious and difficult when there is a large number of machines. Further adding, machine failures are sometimes uncertain also. So depending totally upon this method is definitely not a great idea.
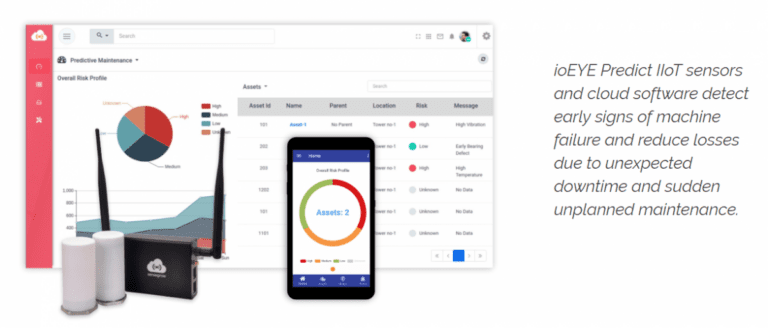
The best way to plan, prioritize, and manage maintenance activities is by using more advanced technologies like Predictive Maintenance, where machines are wireless monitors using sensors and the complete system provides you important alerts in case of abnormal events occurring inside the machines.
We at SenseGrow offer :
ioEYE Predict: The Vibration Monitoring IoT Platform.
Our ioEYE Sensor also monitors parameters like Ultrasound, Temperature, Magnetic Flux apart from the Machine Vibrations.
The platform will show you the health condition of your rotating machines on our SaaS cloud platform ioEYE Predict, which will help you to plan your maintenance tasks.
Contact us now if you want to know more about our PdM Platform – ioEYE Predict.
What is the principle of vibration analysis?
Vibration analysis monitors a machine’s vibrations to detect faults. Every machine has a unique vibration pattern. Changes in this pattern, often analyzed using frequency analysis, signal potential problems like imbalance or bearing wear, enabling predictive maintenance.
What is the methodology of vibration analysis?
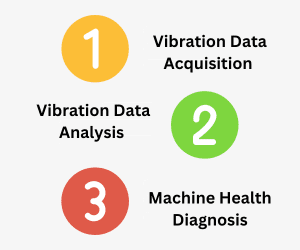
Vibration analysis methodology typically involves:
Data Acquisition: Using sensors to measure machine vibrations.
Data Processing: Analyzing vibration signals to extract key features (e.g., frequency, amplitude).
Fault Diagnosis: Identifying potential problems (e.g., imbalance, misalignment) based on abnormal vibration patterns.
Action Planning: Recommending maintenance actions to prevent equipment failure.


One Comment
Comments are closed.